Quantcast
Channel: Adobe Community: Message List - ColdFusion
Viewing all 21760 articles
Browse latest View live

Re: ColdFusion Builder Download Broken


Re: ColdFusion Builder Download Broken

$
0
0

Oh!  And thank you for marking my answer correct (even though you provided the CFML Repo link.)


V/r,


^_^

Re: ColdFusion Builder Download Broken

$
0
0

BTW.. the second link you provided - that password will be good for a very short time.


V/r,


^_^

Re: ColdFusion Builder Download Broken

$
0
0

No problem...you refreshed my memory...so you get the points :-)

Re: Updating old code, questions about cfcs and functions

$
0
0

Oh, and thank you for marking my answer correct.  I do appreciate it.


V/r,


^_^

Migrating from CF10 to CF12 - Monitor Your App!

$
0
0

I'm posting this for others that may follow or are having performance issues with CF12, although this probably relates to CF11 too.


I was having issues with my migration from CF10 to CF12, specifically around memory management. This is going from Java 7 to Java 8, so my JVM.config settings didn't carry over and the defaults were negatively affecting my apps performance.


I'm not pushing Fusion-Reactor specifically, I don't get paid by them, but it’s one of the first tools I recommend to those running CF. You really have to monitor your app to know what it’s doing. One of the things I really like about this tool is the section that monitors Memory Spaces. This changes based on the type of GC you’re doing.


My app performs best with -XX:+UseConcMarkSweepGC -XX:+UseParNewGC , so I have CMS Old Gen, Code Cache, Compressed Class Spaces, Metaspace, Par Eden Space and Par Survivor Space available in the tool. I tried -XX:+UseG1GC, but it was sporadic. I may revisit it later, but it just wasn’t working for me.


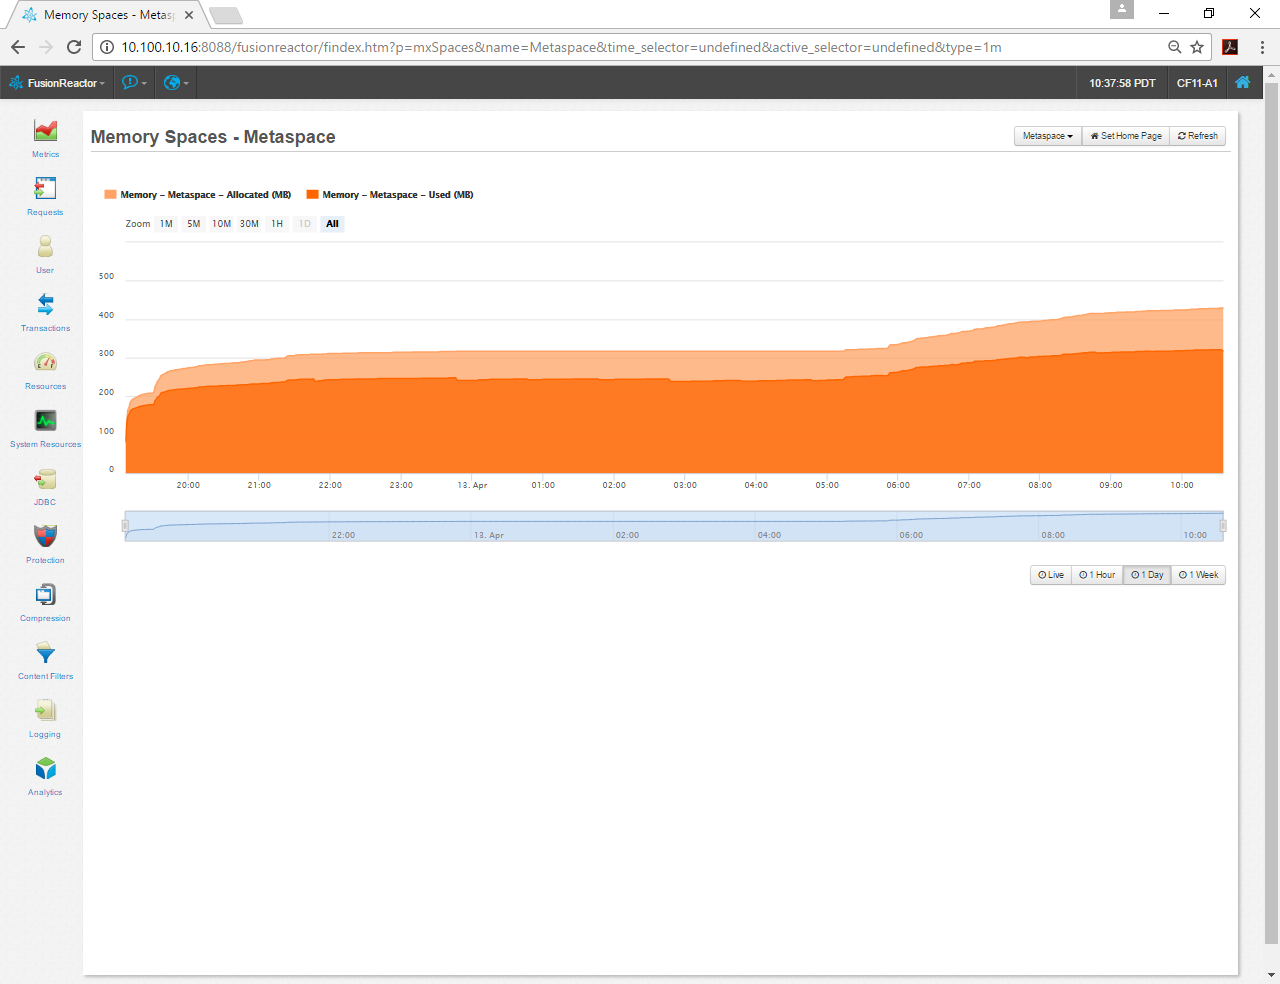
The first obvious thing was the Metaspace, the default size of -XX:MaxMetaspaceSize=192MB was too small. This instance has been running for a day and the charts shows I’m using closer to 320MB. I increased this setting with these two arguments -XX:MetaspaceSize=256m -XX:MaxMetaspaceSize=512m. These are pretty much a replacement for -XX:PermSize -XX:MaxPermSize in Java 7.


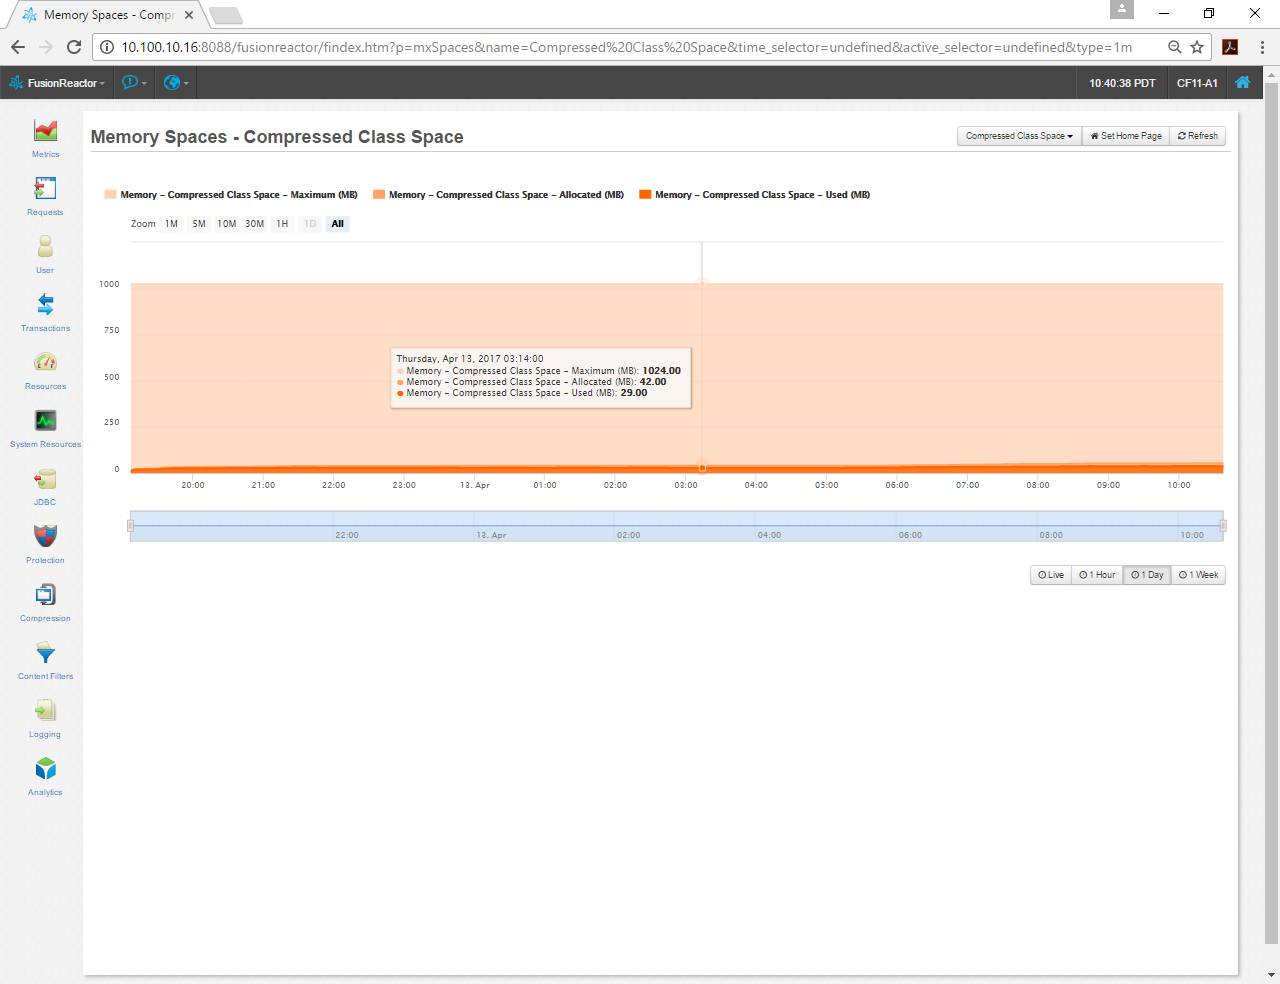
I next noticed that the Compressed Class Space defaults to reserving 1024MB in Java 8. According to my chart, I’m using less than 50MB. This seems like a waste of memory, so I’m going to reduce the default with the -XX:CompressedClassSpaceSize=128m argument.


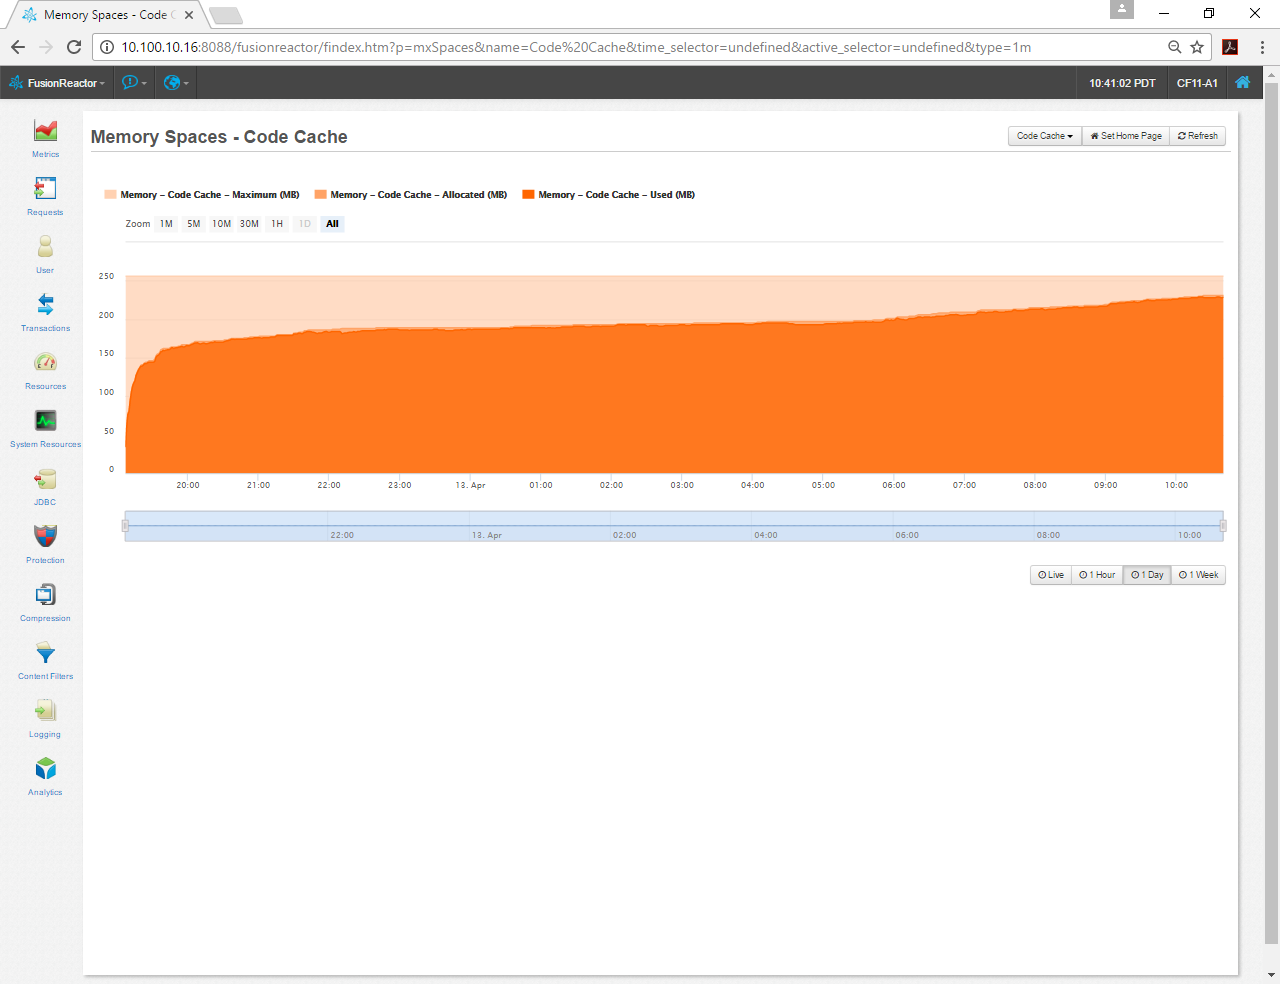
I then noticed that my Code Cache is a little close to maxing out, so I might increase that a little with the -XX:ReservedCodeCacheSize=384m argument.


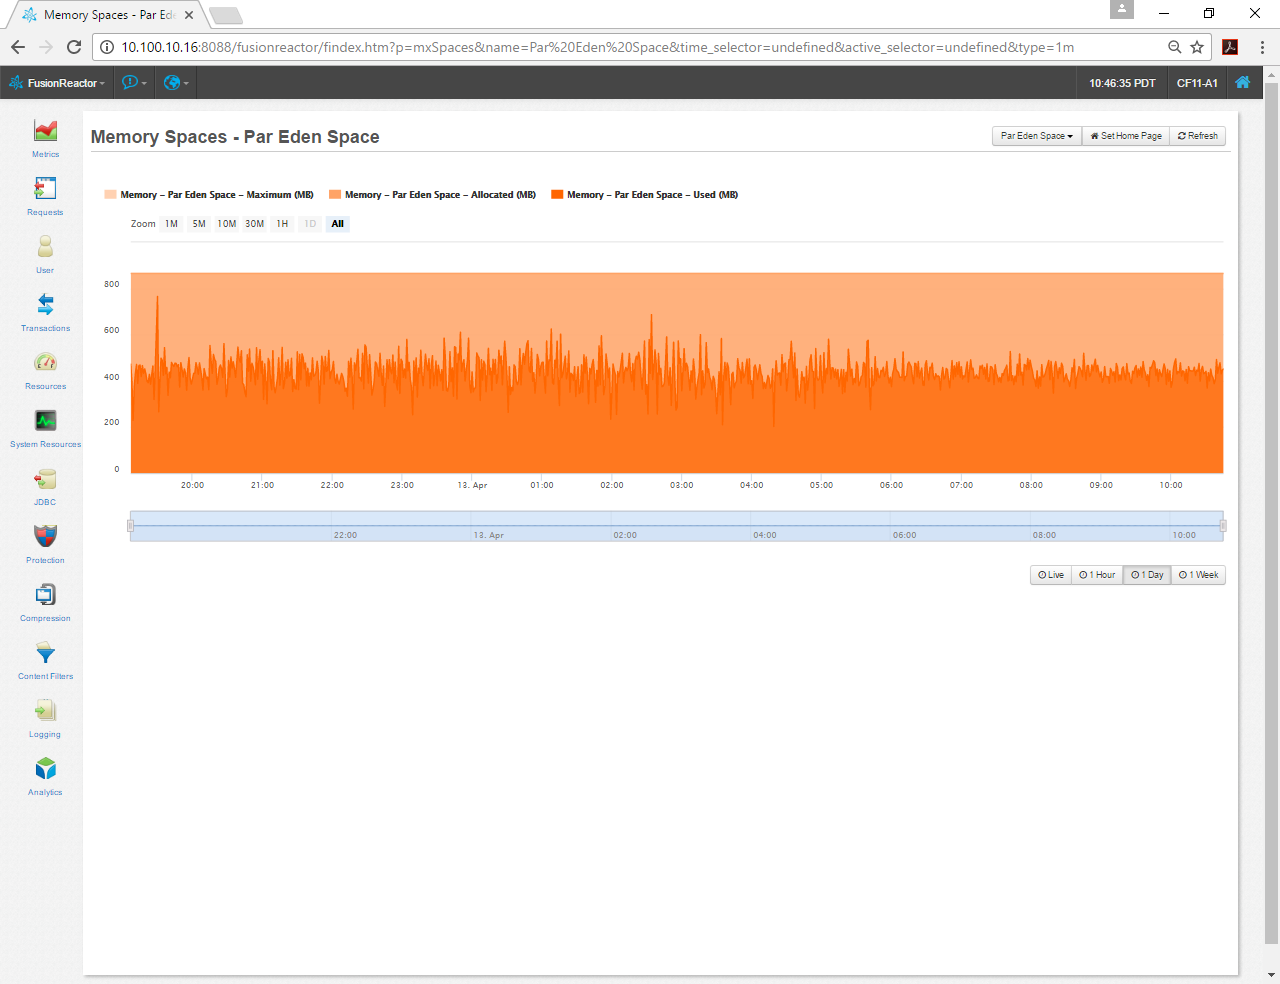
My Par Eden Space looks pretty good, so I’m going to leave that, but if I had issues I might look at these arguments and how they affect my app. -XX:NewSize=1024m -XX:MaxNewSize=2048m -XX:SurvivorRatio=6 -XX:TargetSurvivorRatio=100 -XX:-UseAdaptiveSizePolicy


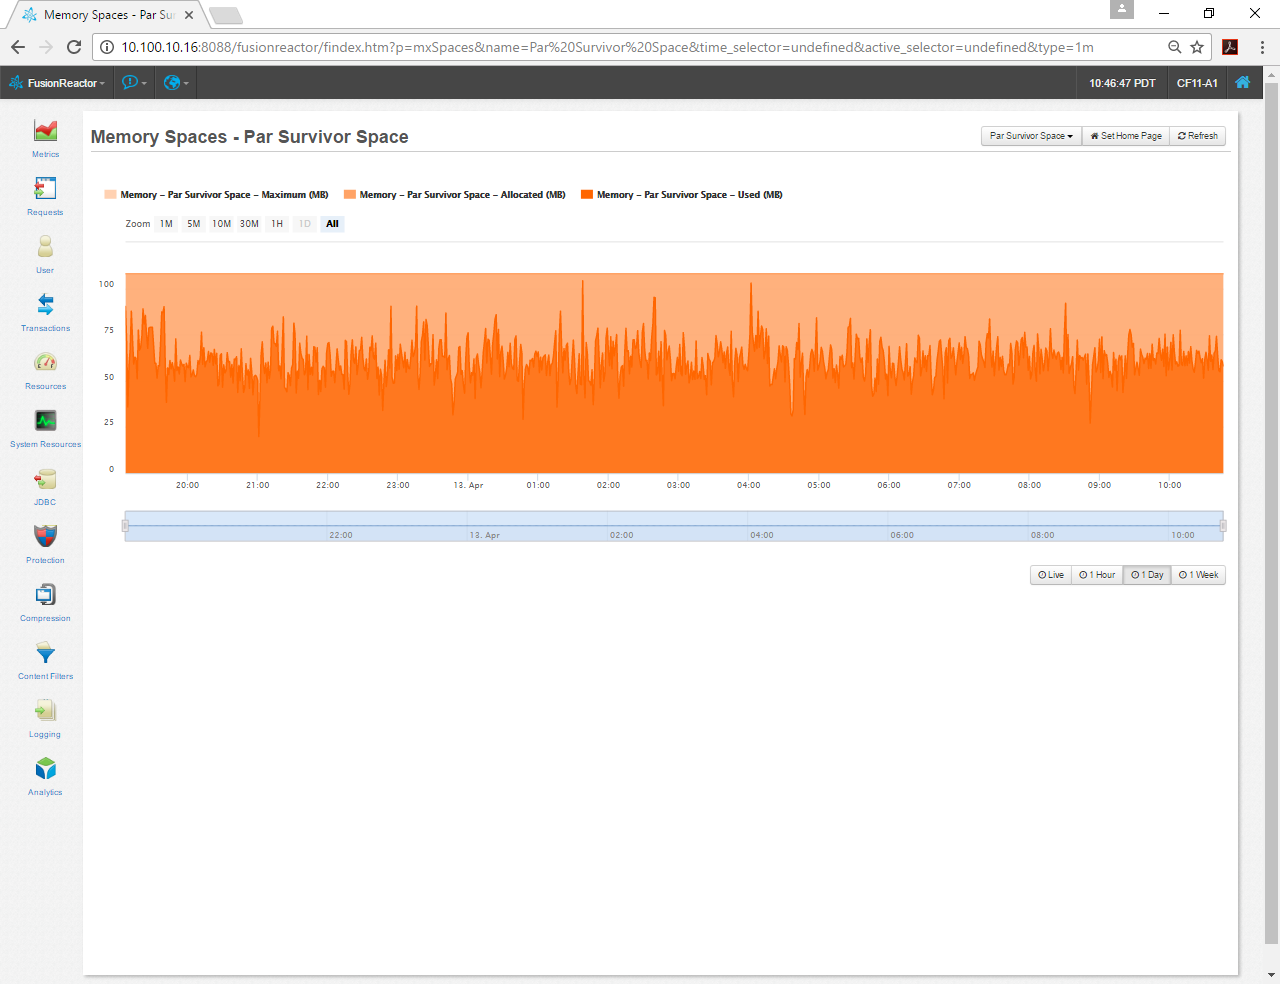
Par Survivor Space looks pretty good too, so I’ll leave it alone.


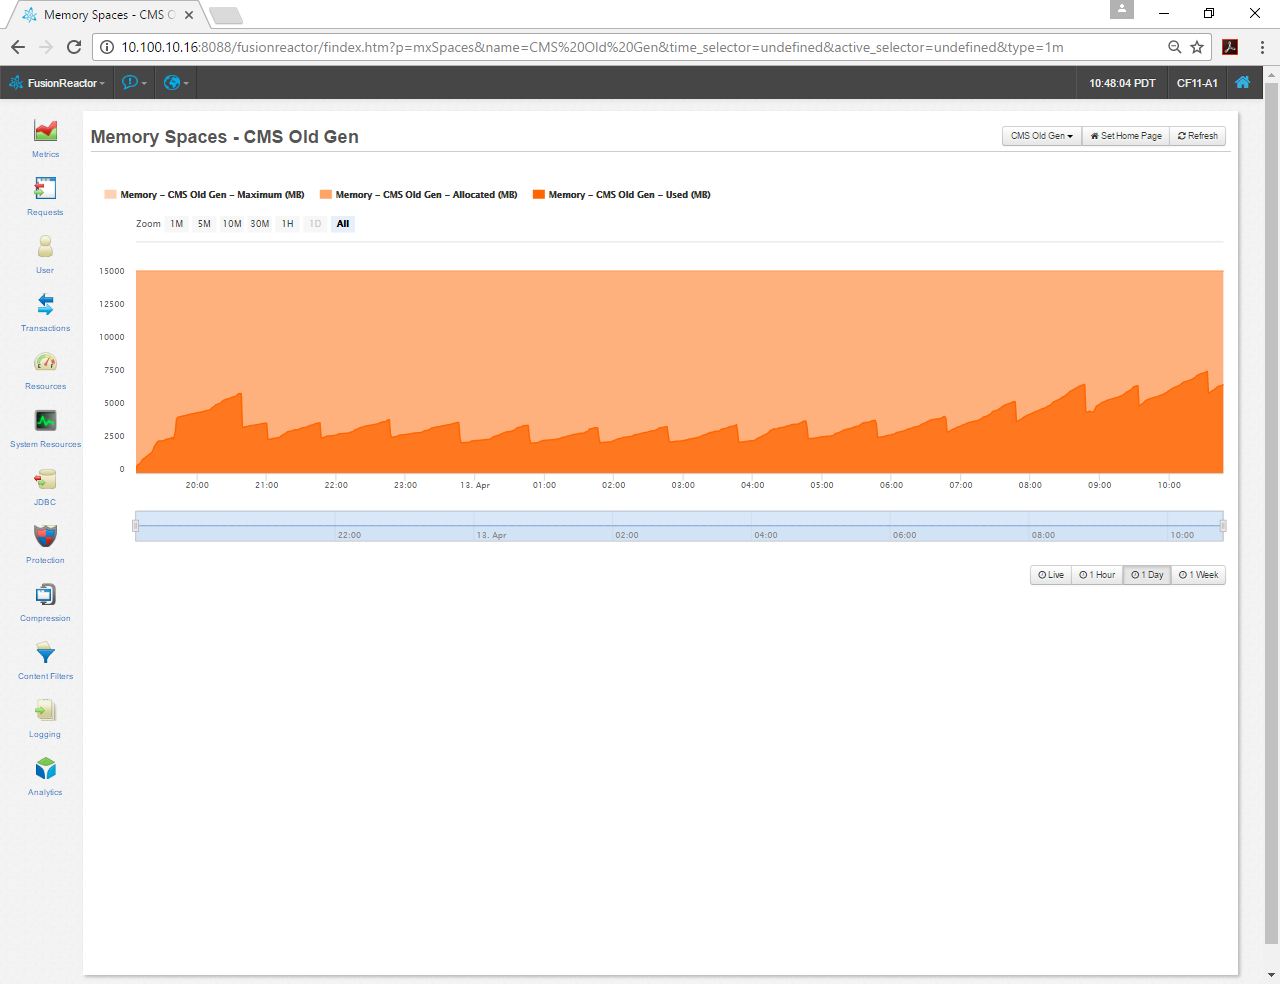
My CMS Old Gen, that’s set with the arguments -Xms16g  -Xmx16g, has plenty of space and GC is doing its job. This instance has only been runnign for 24 hours, so I'll give it a few days. I don't want to give it too much space, because that can cause problems of its own. This app gets about 1 million requests a day and can vary on its workload, so I tend to oversize my heap. I may reduce it a little after I’ve monitored to see where it gets maxed out.


I'm going to give some credit to @carl_type3 for this post and re-post his suggestions that I came across while trying to figure out my new JVM settings for CF12. I found his post helpful and I hope you find this one helpful too. Good luck!


Here are some things to consider. CF11 is using Java 8? The RTM installer deployed Java 7 which is Oracle EOL. The refreshed CF11 installer deployed Java 8 (1.8.0_15).


It can be useful sometimes to set minimum and maximum memory the same.


-Xms6144m -Xmx6144m


Java 8 parameter MaxMetaspaceSize=192m is fair to say small so increase that and define an initial setting.


-XX:MetaspaceSize=312m -XX:MaxMetaspaceSize=640m


There are other Java memory spaces in use so you can tune those to match your load better.


-XX:ReservedCodeCacheSize=724m -XX:CompressedClassSpaceSize=296m


What values to use? Do some traditional Java monitoring to a log and read the log or enable JMX and use some JDK tools like jconsole.


-XX:+PrintGCDetails -XX:+PrintGCTimeStamps -XX:+PrintHeapAtGC -verbose:gc -Xloggc:cfGC.log


-Dcom.sun.management.jmxremote.port=8709 -Dcom.sun.management.jmxremote.ssl=false -Dcom.sun.management.jmxremote.authenticate=false


Java manages objects with garbage collectors (GC). You could be experiencing a pause effect from GC routine. So perhaps try a newer or more modern garbage collector. For that you would remove -XX:+UseParallelGC.


-XX:+UseG1GC


Another idea for GC is to change to low pause. Ditto to remove -XX:+UseParallelGC.


-XX:+UseConcMarkSweepGC -XX:+UseParNewGC


Or stick with throughput GC -XX:+UseParallelGC but provide some tuning to it.


-XX:+UseParallelGC -XX:ParallelGCThreads=16 -XX:MinHeapFreeRatio=40 -XX:MaxHeapFreeRatio=70


The aforementioned G1GC and ConcMarkSweepGC also offer tuning settings, so search on those.


Sometimes Java 8 adaptive sizing does not suit the load after many GC cycles so you might like to manage the New part of heap (made up of Eden and 2 survivor spaces) by defining settings. Note not with G1GC.


-XX:NewSize=2048m -XX:MaxNewSize=2048m -XX:SurvivorRatio=6 -XX:TargetSurvivorRatio=100 -XX:-UseAdaptiveSizePolicy


Similarly tomcat offers performance settings by defining pool, thread size settings and timeout.


EG workers.properties

worker.cfusion.connection_pool_size = 400

worker.cfusion.connection_pool_minsize=100

worker.cfusion.connection_pool_timeout = 60


EG server.xml AJP section

maxThreads="400" minSpareThreads="100" connectionTimeout="60000"


HTH, Carl.

Re: Updating old code, questions about cfcs and functions

$
0
0

I didn't have your address for donuts!

Re: CFX tags not found in Custom Tag Database

$
0
0

Thanks for everyone's suggestions, but the only solution I have discovered thus far is to deploy ColdFusion (Enterprise Edition) as Development and not Production - Secure Profile.  Initially installed CF 2016 on server as a Production - Secure Profile deployment.


I installed CF 2016 on my laptop as a Development deployment. The CFX C++ tags work when deployed as Development.  Web site works. Web site continues to work when switched to Secure Profile on the Security tab in the CF Administrator and the CF service is restarted.


I unchecked Secure Profile on the server installation, restarted the CF service, but the CFX tags still cannot be located.


So, it appears when deploying CF 2016 in Production - Secure Profile something gets set under the covers that prevent CFX C++ tags from working.  Perhaps the answer is to deploy as Development and switch to Secure Profile in the CF Administrator.  If I discover additional information I will post it.


Re: CFCHARTformat=png image not loading on browser

$
0
0

I just started using CF12, upgrading from CF10. I noticed that there may be a memory leak related to using. Settings -> Charting -> Cache Type: Memory.


If you notice that your memory is higher and going up, you may need to set it back to disk. I had to set mine to disk to avoid the memory leak. I hate that they moved to zingchart in CF11, and the memory issue I'm seeing is related. I also noticed that I can't change the Chart Cache Path, so I have to live with the default. Even when I set it through the Admin API and the neo-graphing.xml file, it's still using and stuck in the "...\instance\tmpCache\CFFileServlet\_cf_chart" directory. Interestingly, they seem to be using eHcache to manage the chart caching.


I'm going to try to reproduce the memory leak and submit it as a bug, along with the Chart Cache Path issue. I'm using jProfiler to track down the leak.

Re: Migrating from CF10 to CF12 - Monitor Your App!

$
0
0

So after running live traffic on CF12 for a few days, I noticed the heap growing more than normal and not going down. I suspected a memory leak, so I went for my next favorite tool. If you want to know what's using all that memory, JProfiler is it. It has some other cool functionality, but I've typically used it for looking into memory issues. You can attach to a running instance, but if you do a heap dump, you'll probably crash it.


This picture doesn't show it, but I had an array that was using 4.6G of memory with 187k instances of it. Once I drilled down to the classes, I noticed a bunch of ZingChart related classes. That's way more than it should have been and certainly using too much memory. This gave me enough insight into why all the memory usage. In the CF Admin, I changed the setting from storing CFCharts in memory to using disk. After I moved my chart caching to disk, the memory usage is now normal.


I haven't submitted a bug related to the leak yet, but if you're having issues with memory and using CFCharts and caching them in memory, you might want to change that until Adobe resolves this issue.


Re: CFCHARTformat=png image not loading on browser

$
0
0

When I was looking into this, I realized CF is using Ehcache to cache cfcharts. This is true for both in-memory and disk. They must also be using the timeToLiveSeconds attribute for the expiration and this maps to time-to-live in the CF Admin. I noticed that this attribute was not working for us in CF10 and now CF12. We didn't have a need for it in CF10, so I ignored it. I think this issue might be specific to our setup, I'll need to look into that. So although its a type of memory leak, its just that Ehcache is not expiring the charts in the cache, so they just keep growing. Oddly the time-to-live appears to work when caching to disk.


If anyone else has an issue with timeToLiveSeconds working in Ehcache, let me know and save me some time tracking it down.

Re: Migrating from CF10 to CF12 - Monitor Your App!

$
0
0

When I was looking into this, I realized CF is using Ehcache to cache cfcharts. This is true for both in-memory and disk. They must also be using the timeToLiveSeconds attribute for the expiration and this maps to time-to-live in the CF Admin. I noticed that this attribute was not working for us in CF10 and now CF12. We didn't have a need for it in CF10, so I ignored it. I think this issue might be specific to our setup, I'll need to look into that. So although its a type of memory leak, its just that Ehcache is not expiring the charts in the cache, so they just keep growing. Oddly the time-to-live appears to work when caching to disk.


If anyone else has an issue with timeToLiveSeconds working in Ehcache, let me know and save me some time tracking it down.

Re: CFX tags not found in Custom Tag Database

$
0
0

Switching servers, as you have done, is such a drastic step that I don't consider it a solution. We should look further.


Your last post contains a hint: you move from the Developer Edition to the Enterprise Edition. There are usually some differences between the two editions that could account for the problem. The paths are likely to be different. So, too, are the ColdFusion Administrator interfaces.


So make sure you define the custom tag paths for a ColdFusion instance in the Administrator of that instance. For example, below are the settings as defined in the Administrator of MyFirstCFInstance:


CF_customtag_dir2.png


I clicked on Register C++ CFX. My input for the resulting interface was:


CF_customtag_dir3.png

I had clicked on Browse Server to navigate to the location of the DLL. The path was C:/ColdFusion2016/MyFirstCFInstance/CustomTags/com/employee.dll. When I clicked on Submit, I got the following:


CF_customtag_dir4.png


I then restarted the ColdFusion instance, MyFirstCFInstance.


Finally, the above suggestion assumes that your Application.cfc file contains no code of the form,


<cfset this.customtagpaths="C:\ColdFusion2016\cfusion\wwwroot\customtag">


This code overrides the custom tag paths that you define in the Administrator. So, you should either comment out such a line or set its value equal to the same directory as in the Administrator.

Re: Server Setting Font Management CF11 update 7

$
0
0

Anyone have any more luck with this?

I have a new CF11 installation on windows server 2016 standard.


Trying to add custom font just hangs on submit, no action after several minutes and nothing in the logs.


I tried removing itext.jar but that completely breaks the add font page (guess its a core service now).

Re: CF11: CFChart name parameter no longer works as documented

$
0
0

Did you find a solution? I have the same problem with ColdFusion 2016 update 3.Regardless of creating a jpeg, png or Flash, I get a 500 error saying variable xyz is undefined. Cfchart doesn't seem to be creating a variable with the chart in it. It worked perfectly with CF8 which is what I've upgraded from.


<cfchart name="chart1" ....>


Any reference thereafter to #chart1# throws the undefined variable error. Without any further reference the chart is displayed immediately which is not supposed to happen at all.


I've logged it as bug CF-4198527


Re: CFCHARTformat=png image not loading on browser

$
0
0

Back to your original issue and something I came across while looking into my Ehcache issue.  There is a mapping in web.xml for "CFFileServlet". This is what intercepts the URL call for charts. If you happen to have a URLRewite rule someplace that rewrites URL's to lowercase, then the call to the chart image will all be lower case and not camel case. Having a lowercase URLRewrite rule is common for web apps and SEO optimization. This will cause a 404 when the url "/cffileservlet/_cf_chart/001234.png" is lowercase. If you have the lowercase rule, you'd need to add a mapping for "CFFileServlet" for the lower case call.


<!--- specific to camel case mapping --->

<servlet-mapping id="coldfusion_mapping_14">

        <servlet-name>CFFileServlet</servlet-name>

        <url-pattern>/CFFileServlet/*</url-pattern>

</servlet-mapping>


<!--- needed to support lowercase --->

<servlet-mapping id="coldfusion_mapping_15">

        <servlet-name>CFFileServlet</servlet-name>

        <url-pattern>/cffileservlet/*</url-pattern>

</servlet-mapping>

Re: ColdFusion 11 Destroyed My Charts

$
0
0

I'm trying to upgrade from CF8 to 2016. Every single chart in our application looks awful in 2016. It's taken a whole day just to make a few charts look decent but they're still not as nice as CF8 charts. One type that's proving tricky to fix are pie charts. Or pea charts as I call them now because they're so tiny!


I've attached an example. Notice it doesn't fill the plot area. I can't find a way to remove the labels or place them inside or over the slices to allow the pie to become bigger.

temp1.jpg

Re: ColdFusion 11 Destroyed My Charts

$
0
0

It's all trial and error using ZingCharts JSON styling.  Here's the link to their site:


JSON Attributes | ZingChart


To get you started here's one of the examples we put together to get some of our pie charts back to "normal".


<cfset plotarea ={

                    "adjustLayout"=true,

                    "alpha"=1,

                    "margin-top"=5,

                    "margin-right"=5,

                    "margin-left"=5,

                    "margin-bottom"=0

                }>

        <cfset title = {

                    "visible"=false,

                    "backgroundColor"="##dcdcdc"

                }>

        <cfset border = {

                    "borderColor"="none"

                }>

        <cfset legend = {

                    "visible"=false

                }>

        <cfset plot = {

                    "highlight"=false,

                    "value-box"={

                        "placement"="out",

                        "connected"=false,

                        "text"="%t",

                        "font-color"="##5A5A5A",

                        "type"="all"

                    }

                }>

        <cfchart

            databackgroundcolor="##dcdcdc"

            backgroundColor="##dcdcdc"

            plotarea="#plotarea#"

            title="#title#"

            border="#border#"

            legend="#legend#"

            plot="#plot#"

            chartwidth="460"

            chartheight="260"

            show3d="yes"

            name="pieChart">

Re: CF11: CFChart name parameter no longer works as documented

$
0
0

Since we're talking about cfchart, anyone notice some of the other issues? Did this break in ColdFusion 2016 Update 3, or has it always been broken? I noticed that you can't set a custom Chart Cache Path for caching in the CF admin. I also noticed that even if you set Cache Type to "Memory", that it still appears to write the charts to disk in the default location that I can't change. "...{Instance}\tmpCache\CFFileServlet\_cf_chart". I also noticed that if you keep refreshing the same chart, it doesn't appear to use the cached version, but just keeps generating new ones. I also noticed that the charts end up in the jvm heap (Noticed them with JProfiler), but are never released, causing a memory leak. Something is wrong!

Re: ColdFusion 11 Destroyed My Charts

$
0
0

Thanks, that's very useful. I will give those settings a try.

Viewing all 21760 articles
Browse latest View live


Latest Images

<script src="https://jsc.adskeeper.com/r/s/rssing.com.1596347.js" async> </script>